
Case Study · Runway Rogue
At 10:30 on our first night, we switched off every ad we had launched for Runway Rogue. By February the account had a week of 990 purchases.
Facebook and Instagram ads, and the creative behind them, for a lip-colour brand. Results from the weekly reports, December 2018 to April 2019.
01 · October 22, 2018
Day one
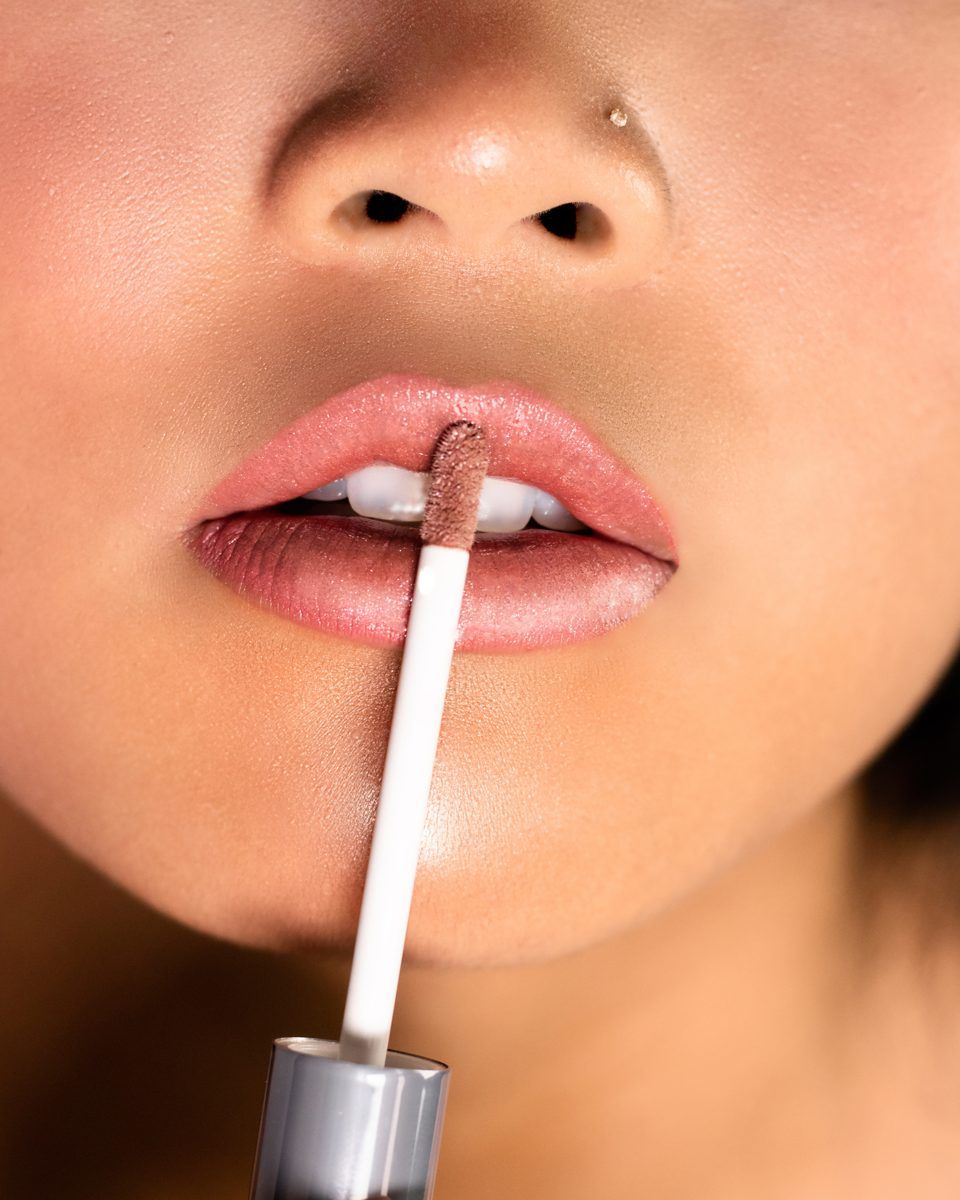
Runway Rogue sold lip colour online and hired us to run its Facebook and Instagram ads and make the creative. We went live on October 22.
That evening the client messaged us. The numbers were well under where they should have been, even for a first day. At 10:30 that night our media buyer switched off every ad we had launched and wrote in the account log: "I want to save their money while I evaluate and relaunch in the morning."
Two days later, after a relaunch that also underperformed, we switched our ads off again.
02 · The 2018 numbers
Who was actually buying
On October 26 we went back through everything the account had done that year, broken out by age. Buyers aged 45 to 54 had made more than half of all purchases, 53.5%, and brought in $2.73 in sales for every ad dollar. Buyers aged 18 to 24 brought in $1.08.
We pointed the running ads at 45 to 54 the same day.
03 · November and December
Testing, and switching off
The account log from those weeks records a lot of switching off: weekend ads that underperformed, ad sets with very low click-through, a cold-audience lip gloss campaign, and a set of lookalike campaigns we turned off after one day with the note "Turned off the new campaigns from yesterday, not working."
Alongside the cuts, we retargeted people who had browsed the site, added to cart or bought before, and after a conversation with the client we moved some campaigns to cost caps. From January, our creative team shot new model photos, shade by shade.


04 · Callback
Back in stock
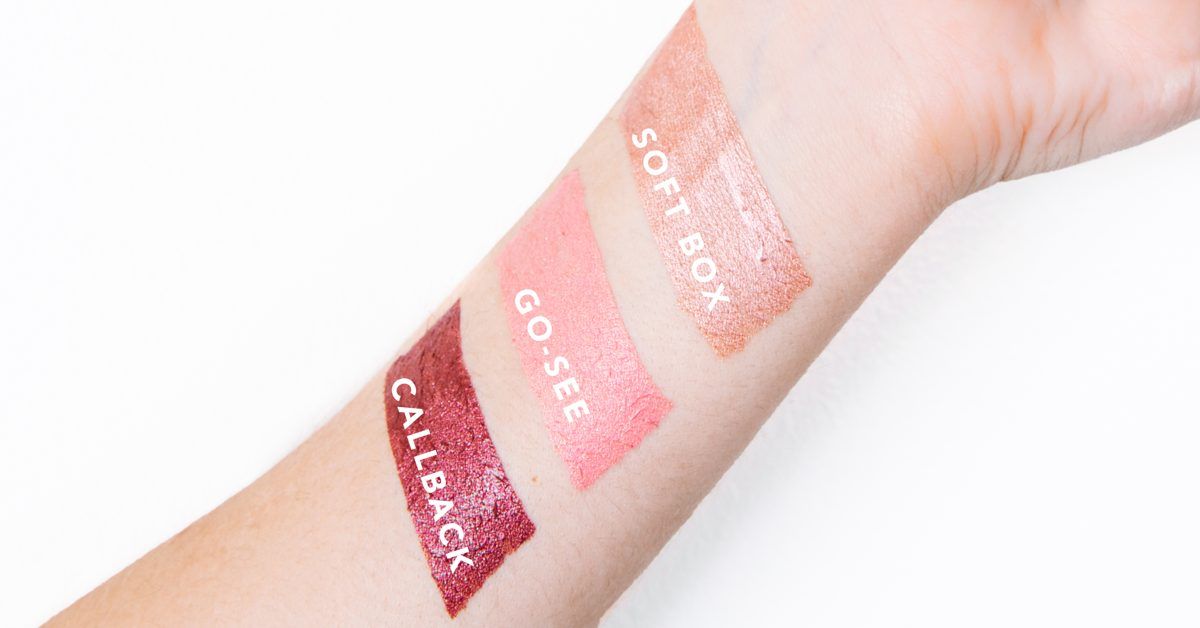
In February 2019 the Callback shade came back in stock, and we ran a campaign for it. In its first week on Facebook it brought in $4.73 in sales for every ad dollar, on 213 purchases.

05 · The weekly reports
Purchases, week by week
| Week | Purchases |
|---|---|
| Nov 28 to Dec 4, 2018 | 197 |
| Dec 12 to 18, 2018 | 102 |
| Jan 2 to 8, 2019 | 612 |
| Jan 9 to 15, 2019 | 449 |
| Jan 16 to 22, 2019 | 397 |
| Jan 24 to 30, 2019 | 418 |
| Feb 6 to 12, 2019 | 565 |
| Feb 20 to 26, 2019 | 990 |
| Feb 27 to Mar 5, 2019 | 848 |
| Mar 13 to 19, 2019 | 503 |
| Mar 20 to 26, 2019 | 664 |
| Mar 27 to Apr 2, 2019 | 583 |
In 2018, before us, the account averaged about 229 purchases a week at $13.92 each. Across the ten weeks we reported from January to April 2019, it averaged 603 a week at $13.20 each. The best week, February 20 to 26, brought in 990.
Later ads, May and June 2019
Ads getting clicks, not sales?
Let's talkReady to Maximize Your Social Media
Potential?
We’d love to hear about your organization’s goals on social media. Get in touch with us today!
If submitting an RFP, please use the email below.