Dynamic remarketing
First tried during Blue Friday week. It showed people the exact parts they’d looked at and left. It became the biggest line in the account: $1.01 million at 12.43x.

From September 2020 to July 2022, each dollar PartsVu put into Facebook and Instagram ads came back as $9.80 in tracked sales, on average. Two of the five biggest earners were maintenance charts.
Below the waterline
In 2019, PartsVu’s Blue Friday sale week brought in 893 orders and $110,153.
PartsVu sells genuine Yamaha, Mercury and MerCruiser parts out of Naples, Florida: water pumps, filters, oil, the kits that decide whether a Saturday on the water happens. Plenty of sites sell those. PartsVu’s difference was knowledge. It would help you work out which part your engine needed, order it, and put it in.
Most of that knowledge reached people once they were already on the site.
Nobody browses for a fuel filter. Boat owners buy parts when the engine’s hours say it’s time, and they look up what to buy before they buy it.
orders · $110,153 in revenue
In October 2020 we launched four campaigns on the same day, all set up to sell.
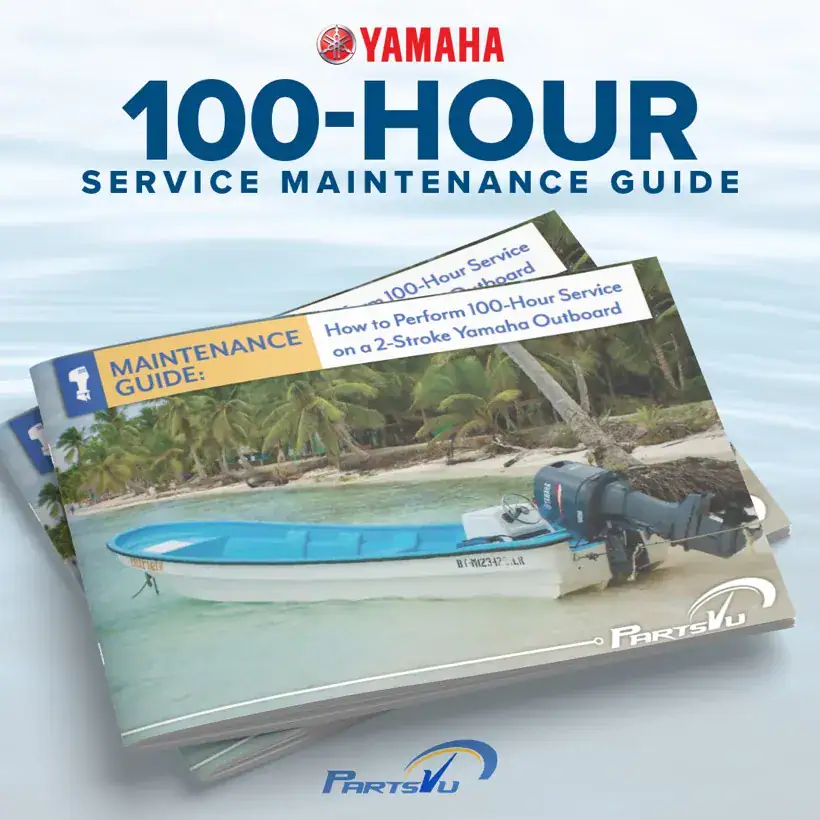
Two paired a fall sale with an engine maintenance chart, one for Yamaha owners and one for Mercury owners. The other two led with something to read: an ebook on the 100-hour service, and an article on winterizing.
PartsVu’s Yamaha customers got the Yamaha chart. Its Mercury customers got the Mercury chart. We built each audience from PartsVu’s own customers for that engine brand, then found more people who looked like them.


A 2021 filter sale, made in a Yamaha version and a Mercury version
Tracked sales from launch to July 2022.
Return on ad spend
| Campaign | Two weeks, Jun to Jul 2021 | Dec 14 to 27, 2021 | Feb 8 to 21, 2022 | Jan to Mar 2022 | September 2020 to July 2022 |
|---|---|---|---|---|---|
| Yamaha maintenance chart | 7.41x | 5.51x | 11.19x | 10.21x | 10.43x |
| Mercury maintenance chart | 6.42x | 3.37x | 18.41x | 9.36x | 10.55x |
The charts stayed on.
By July 2022 those four campaigns had spent $109,478 and brought back $1.18 million in tracked sales. Both maintenance charts were still among the account’s top campaigns in the first quarter of 2022.
Over the engagement the account ran more than 100 campaigns, and the budget followed the ones that paid.
Campaigns that returned 10x or better got 58% of the budget and brought in 74% of the tracked sales. Campaigns that returned under 5x got 14% of the budget and brought in 2%.
First tried during Blue Friday week. It showed people the exact parts they’d looked at and left. It became the biggest line in the account: $1.01 million at 12.43x.
MerCruiser got its own campaign: $469,354 at 11.30x.
Magma grills brought in $360,801 at 14.74x. Raymarine electronics brought in $116,169 at 17.42x.
The work
The feed ran alongside the ads: fishing, the Aquaholics Anonymous rewards program, holidays on the water, and posts that were just about loving the boat. Around them sat maintenance guides, safety tips, product sales and short video.




Blue Friday 2020 was our first holiday season with PartsVu. We ran the week as its own set of campaigns: the main sale, daily Blue Light specials, Cyber Monday, and retargeting for people who browsed and left. The main Blue Friday campaign spent $1,400 and brought back $42,398, a 30.29x return.
The Monday after, PartsVu’s marketing director wrote:
“Many thanks to you all for a successful Blue Friday week. When compared to last year we significantly improved across all key metrics, even with our typical YOY growth considered. I am also happy to announce this was our first $100k short term marketing campaign!”
His numbers came from PartsVu’s own records, for the whole store.
PartsVu · 2019
PartsVu · 2020
He broke out Facebook separately: 269 orders and $55,519, at $206.39 an order. That’s $56 more per order than the store’s average that week.
Counting Blue Friday week, the eight holiday campaigns we launched between November 15 and December 28 spent $12,505 and brought back $237,964 in tracked sales.
Across the engagement:
The return moved with the boating calendar. Two back-to-back two-week windows between mid-June and mid-July 2021 came in at 10.62x and 10.69x. Two weeks in December 2021, the 14th to the 27th, came in at 6.99x. January 2022 was 9.03x. February was 10.30x, and March 10.15x.
Scale 0x to 12x. The yellow line marks 10x.
January to March 2022, winter months included, added up to $113,780 in spend, 4,359 purchases and $1.12 million in tracked sales: 9.88x.
In December 2021 we built PartsVu a YouTube plan. One of our first questions for them was why comments were turned off on their videos.
The plan used the same split as Facebook: someone who bought a Yamaha part only sees Yamaha ads. It proposed cutting PartsVu’s existing videos into six-second bumpers, and it called for longer how-to videos for owners who want to learn the job themselves. The deck pitched a Bob Ross-style maintenance series.
A bumper ad lasts six seconds at most and can’t be skipped.
In the first quarter of 2022, the Google Ads account, YouTube included, served 4.61 million impressions and 1.24 million video views. March alone brought 904,111 views.
Boat parts sell on the engine’s schedule. Show owners the schedule, and they buy the parts from you.
Let’s find the moment your customers need you.
We’d love to hear about your organization’s goals on social media. Get in touch with us today!
If submitting an RFP, please use the email below.