Case study · Brain Balance Centers
Brain Balance gave its franchisees rules and a feed to copy. We gave them something to start from.
How Sociallyin rebuilt social for a franchise network, from November 2025 to September 2026.

01 · Two Kinds of Brain Balance Page
Parents saw two different Brain Balances in one feed.
Brain Balance is a network of franchised centers, and each one posts to its own community. Some centers made their own content. It came out off-brand, off-tone and rough. Other centers pasted the same home-office post as every other center, and parents scrolled past it.
A parent could not tell which center to call. Our partnership began on September 15, 2025. Corporate had published no brand content in October, and our first posts went live in November. Everyone wanted proof, including a board watching the spend.
Brand guidelines told franchisees what not to make.The old opt-in feed told them what to paste.Neither gave them something to start from.
02 · December 1
December 1 turned the feed into a shelf.
On December 1, Brain Balance moved away from the opt-in system for home-office posts.
In its place came a monthly folder of suggested posts and strategies for centers to follow. Franchisees also got a monthly deck and a recorded walkthrough. Live all-hands calls ran at launch.
Every center takes the same card and makes it its own.
Illustrative example. The old way: the same post in every town.Illustrative example. The shelf: the same card, made local.
03 · Real People, Real Centers
Then we sent crews into the centers.
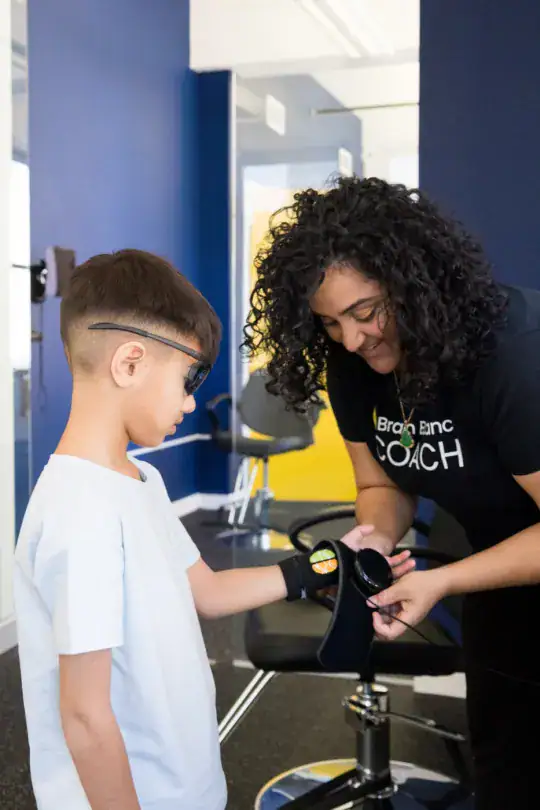
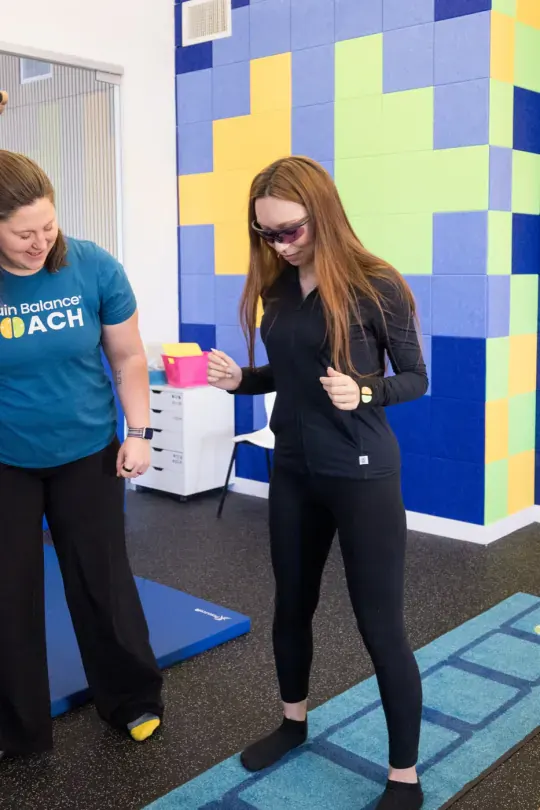
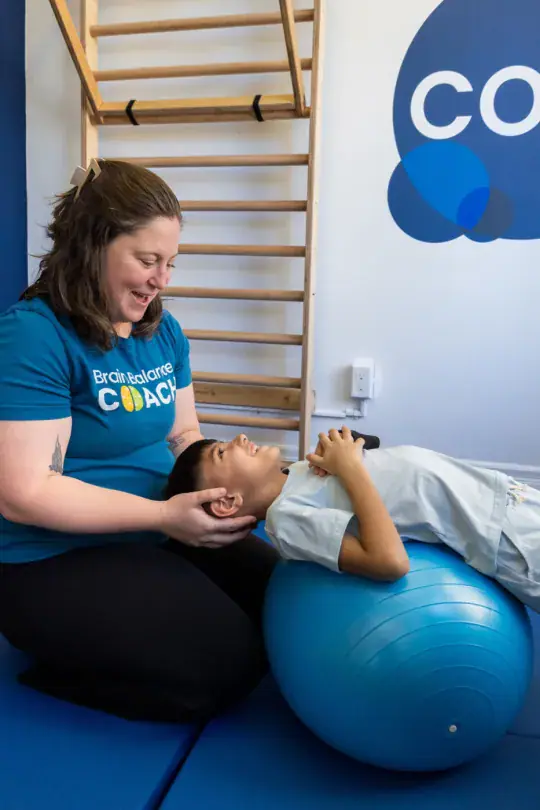
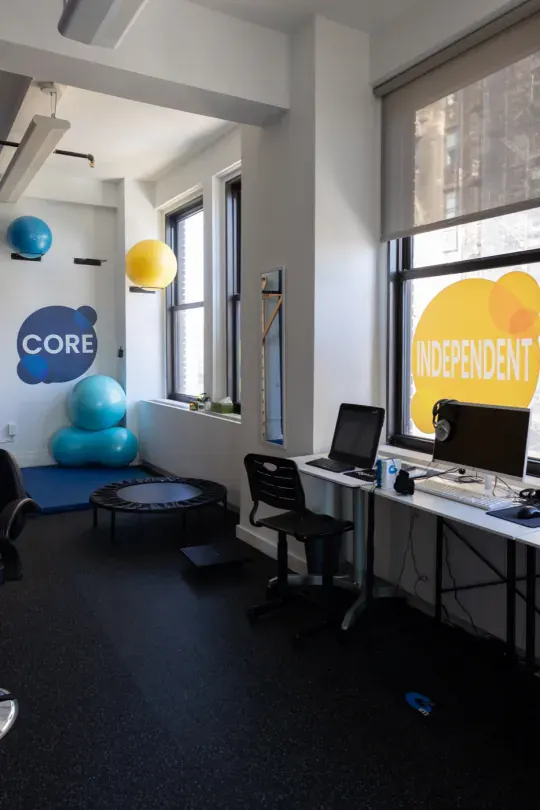
Sociallyin production crews went into centers in Denton and the Dallas area, in Brooklyn and in Norwalk, Connecticut. Creators from our creator network shot social-first inside the centers, and Sociallyin Studios edited the footage. The first shoot alone produced 250 edited photos and 130 short video clips.
In July 2026 we shot the franchise convention in Scottsdale and came back with interviews with most of the franchise owners.
The monthly reports kept finding the same thing.
Every top-performing post had a real person in it. Every low performer led with a branded graphic.
Illustration of the pattern, not a chart of data
04 · On Camera
This is what person-led looks like.
Creators from the Sociallyin creator network made social-first videos for Brain Balance, at home and in the centers. Franchise owners went on camera too.
Videos play muted. Use the speaker button for sound.
Inside the centers
05 · Quarter by Quarter
Engagement rate rose every quarter.
Quarterly engagement rate went from 1.33% to 1.66% to 2.22%, and engagements grew with it.
Engagement rate by quarter
Organic national channels
TikTok engagement rate: 3.06% in Q2, 5.45% in Q3
December 2025 was the lowest month in the period and September 2026 the highest. Both had the same post count.
Same post count, 3.7x the engagement. Each dot is a post. Lit dots show engagement, scaled so September’s 1,797 fills the grid.
What the website saw
Sessions from organic social sources in GA4, and key events recorded in GA4. Up year over year.
Method. Organic national channels only. Figures are from the client’s monthly and quarterly reports, which Sociallyin prepared with Brain Balance’s team. Engagement rates are quarterly. Q1 engagement uses the corrected February figure. GA4 compares each quarter with the same quarter a year earlier. Key events are those recorded in GA4. Audience-size figures are not part of this study.
06 · The Board Meeting
One report for the board, one for every center.
GA4 ties organic social to the website, so sessions and key events could sit next to engagement. We rebuilt Brain Balance’s reporting into one system, with a corporate view and a franchisee view. The marketing lead walked into board meetings with it.
CORPORATE VIEW
FRANCHISEE VIEW
Illustrative layout built from the figures above.
07 · In Their Words
I can’t speak highly enough about what it’s been like working with you. A huge bright spot for me.
Franchisees don’t ignore brand guidelines. They run out of things to post.
Franchise and multi-location social
How many versions of your brand are live right now?
Sociallyin runs social for franchise and multi-location brands. Bring us your feeds and we will show you what your shelf could look like.
Schedule a CallReady to Maximize Your Social Media
Potential?
We’d love to hear about your organization’s goals on social media. Get in touch with us today!
If submitting an RFP, please use the email below.