
SAMSUNG DISPLAY
4% on LinkedIn. Every competitor under 1.6%. Seven years on the account.
Samsung Display sells screens into eleven verticals and has no in-house creative team. Sociallyin has run the entire social operation for seven years: strategy, production, Sprinklr, executive social, influencer, on-site crews, and weekly PR readiness. This is the machine that does it.
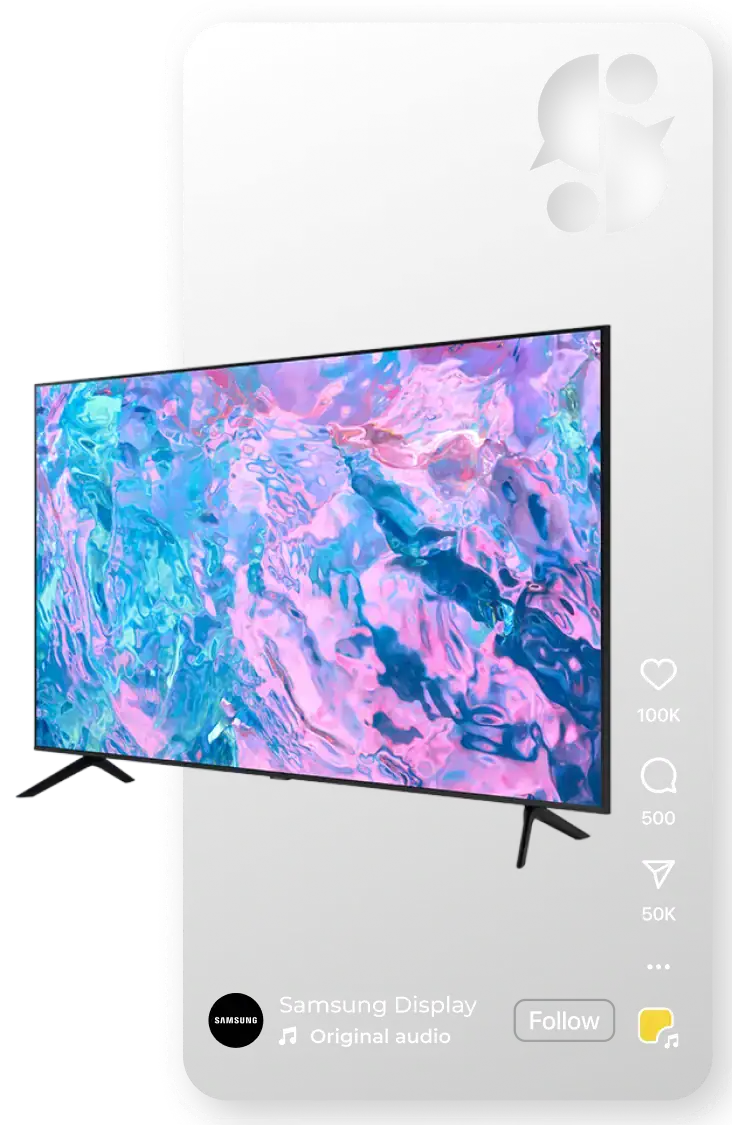


4.14%
LinkedIn ER · 2.6× the nearest competitor · Q3 2025

+44.6%
Total audience · 244,798 → 353,975

7 years
Continuous retention on one enterprise account

CLIENT
Samsung Display

Industry
B2B Enterprise · Display Technology

Engagement
Seven years · ongoing · 11 verticals

Offering this proves
Full-Service Enterprise Social
01
THE STUCK POINT
Eleven verticals. One content
queue. Zero internal creative team.
Samsung Display is the B2B display division of Samsung Electronics America. It sells screens into airport concourses, hospital wings, drive-thru menu boards, lecture halls, stadium scoreboards, hotel lobbies, and federal buildings, eleven distinct verticals by the time we were tracking them individually in 2025.
When the work started, that content ran through five LinkedIn showcase pages, five Twitter handles, two Facebook pages, two Instagram accounts, and a YouTube channel. Two more showcase pages launched in April 2021. Each vertical had its own buyer, its own product line, its own compliance language, and its own page to feed.
Samsung Display had no internal creative team to feed any of it. Not a small one. None.
In April 2021 the account portfolio held 244,798 followers. The largest property on that list was shrinking month over month. The problem was that eleven audiences were being served out of one content queue, ordered by whichever approval came back first.
The diagnosis: enterprise brands do not lose social because the creative is weak. They lose it because nothing gets through the approval chain fast enough to matter. The agency work that matters is not the idea. It is the throughput.
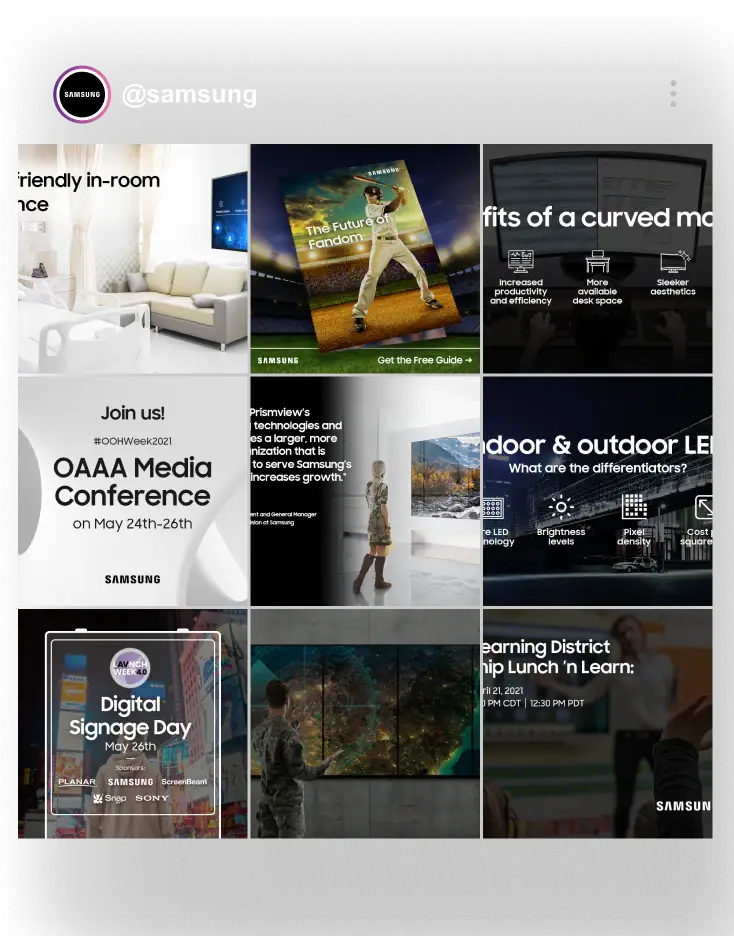
Verticals to serve
11
Each with its own buyer
Internal creative team
ZERO
Not small, none at all
Audience, April 2021
244,798
Largest property shrinking
02
THE BET
Tag everything. Survive the approval
chain. Show the numbers in person.
Before a single asset was produced, we set three rules the whole operation would be measured against, and agreed on what would count as a win before there was anything to count. That sequencing is the part most agencies skip, and it is why the quarterly review became a working session instead of a defense.
Three Standards
Before The First
Post Shipped.
Every Quarter · Seven Years · One Room
Seven years of 90-day readouts going post by post through what worked, what didn’t, and what the next quarter should look like.

Tag Every Post
Every post tagged to a vertical and to a product line at the moment of creation, not reconstructed later at reporting time. That tagging is what makes eleven verticals reportable instead of anecdotal.

Survive The Chain
Nothing ships without clearing legal plus internal reviewers. We did not try to shorten the chain. We built Sprinklr’s approval routing so the chain could run without stalling the calendar and PR breaks could move within the news cycle.

Read Numbers Out Loud
Quarterly business reviews in person, every quarter, for seven years. Not a dashboard link. A room. Samsung’s executive team is numbers-first, so the attribution was built before the content calendar was.
Every Quarter · Seven Years · One Room
Seven years of 90-day readouts going post by post through what worked, what didn’t, and what the next quarter should look like.
03
THE WORK
Six parts, running at once, for
seven years.
None of these are campaigns. They are standing capabilities that produce every week whether or not anyone has a big idea that month. The machine is what keeps a brand like Samsung Display on social without an internal team and at 4% on LinkedIn, with every competitor under 1.6%.
Part 01
Vertical Content Engine
Graphics, photography, video, and copy produced per vertical, not repurposed across them. A hospital buyer and a QSR operator do not respond to the same proof. Sociallyin staffed to make eleven versions of the argument, not one flexible one.
11 arguments · not 1

Sprinklr Operating Layer

Executive Social
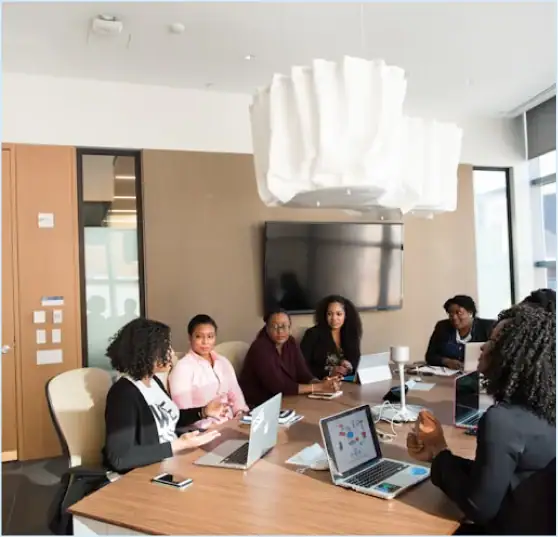
Influencer Per Vertical
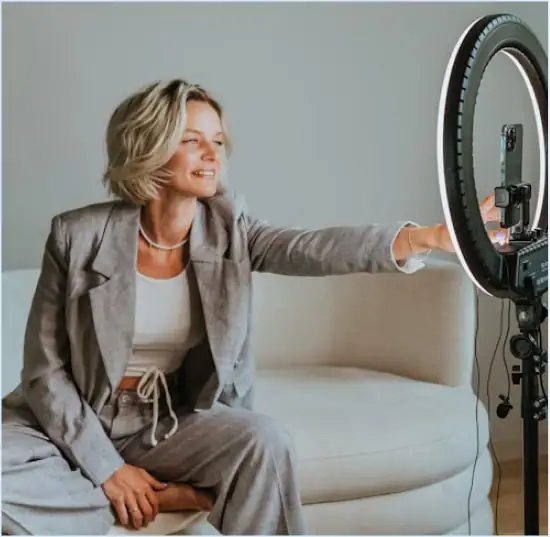
On-Site Production Crews

PR Distribution On Short Notice
“
This is really well thought through. Thank you for presenting this. Another well done QBR.

Dana
Samsung Display
LinkedIn ER
4.14%
vs. competitors
2.6×
Retention
7 yrs

04
THE INFLECTION
We killed the pages we spent three years building.
By 2023 the LinkedIn showcase pages were working. Two of them had been launched from six followers each in April 2021 and grown past 600. Spectaculars and DOOH was the fastest-growing showcase page in the portfolio.
And it was the wrong architecture. Seven pages meant seven audiences that each saw a fraction of the work, seven follower bases that never compounded, and a content team splitting output instead of concentrating it. We recommended collapsing them, and said so in the QBR.
Before consolidation · Q2 2023
23.5
Avg. engagements per LinkedIn post
7 showcase pages · audience fragmented

After consolidation · Q1 2024
80.4
Avg. engagements per LinkedIn post
1 page · +242% · smaller post volume
Consolidation is an easy recommendation to make about someone else’s pages. These were ours. We had built them, reported on them quarterly for three years, and used their growth as proof the program was working.
LinkedIn does not let you merge pages. You request follower migration, rename what can be renamed, pin notices on the pages being retired, and accept that some audience will not follow you across. We mapped the first two migrations in Q3 2023. By Q1 2024 the whole portfolio was running on one Samsung Display page.
It cost something immediately. Q1 2024 engagement rate fell 29.9% against the prior quarter while followers reoriented. We reported that number in the QBR rather than burying it, because the other number in the same deck was the one that mattered: average engagements per LinkedIn post went from 23.5 in Q2 2023 to 80.4 in Q1 2024, a 242% increase on a smaller volume of posts.
One page. Three and a half times the engagement per post. The audience was never the constraint. The dilution was.
05
THE PROOF
Seven years of quarterly reviews,
in one table.
Every figure below is pulled from a quarterly business review deck presented to Samsung Display between Q1 2021 and Q3 2025. Nothing here is modeled or projected. Source is noted per row. Engagement rate is calculated as total engagements divided by total impressions. The Q1 2021 reporting basis differs from later quarters and is excluded from all trend comparisons.
Core Platform Performance
Metric
Result
QBR Source
Details
$
Metric
Total Audience
+44.6%
Result
Q2 2021 · Q3 2024
QBR Source
244,798 → 353,975 followers across all accounts. End figure came in 3% above the follower KPI Samsung set for the year.
Details
$
Metric
Engagement Rate
2.04% → 4.59%
Result
Q2 2021 · Q3 2022
QBR Source
Q2 2021 to Q3 2022. The Q3 2022 figure was a 33% quarter-over-quarter jump on its own.
Details
$
Metric
LinkedIn Engagement Per Post
23.5 → 80.4
Result
Q2 2023 · Q1 2024
QBR Source
Q2 2023 to Q1 2024, across the showcase page consolidation. A 242% increase on a smaller volume of posts.
Details
$
Metric
Follower Growth Rate
0.61% → 1.99%
Result
Q3 2024
QBR Source
Average monthly follower growth, 2023 vs. 2024. The consolidation year tripled the compounding rate.
Details
I
Metric
+53.9%
Result
Q3 2024
QBR Source
49,425 to 76,048 followers over nine months in 2024, the fastest growing platform in the portfolio.
Details
Beating Benchmarks · Influencer
Metric
Result
QBR Source
Details
R
Metric
Beating Paid, Organically
1.34%
Result
Q3 2021 (Statista)
QBR Source
Q3 2021 average CTR on organic content, against a 1.2% worldwide benchmark for paid social advertising.
Details
C
Metric
Beating Samsung Mobile
+36%
Result
Q2 2021 · Q3 2021
QBR Source
In Q2 2021 Samsung Mobile’s ER ran 7% ahead of Display’s. One quarter later Display was running 36% ahead of Mobile’s. Same company, different operating model.
Details
L
Metric
Influencer, Revenue Attributed
$23,000
Result
Q3 2023
QBR Source
Attributed sales through an education influencer’s promo code at FETC & TCEA 2023, on $9,250 in program spend. The same partnership delivered 478,588 impressions and 35,227 link clicks.
Details
Inbound Sentiment · LinkedIn Benchmark
Metric
Result
QBR Source
Details
$
Metric
Inbound Negative Sentiment
11.8% → 5.6%
Result
Q3 2022 · Q1 2023
QBR Source
Share of inbound community messages classified negative, cut by more than half across two quarters of active community management.
Details
I
Metric
LinkedIn ER · Q3 2025 Benchmark
4.14%
Result
Q3 2025 competitive audit
QBR Source
vs. LG Business Solutions 1.58% · Planar 1.51% · ViewSonic 1.51%. 2.6× the nearest competitor. Samsung Display posts 25/month; Planar and ViewSonic post 35 each.
Details
4.14%
LinkedIn ER · Q3 2025
2.6× nearest competitor
+44.6%
Total audience · 244,798 → 353,975
3% above KPI
+242%
LinkedIn eng/post · after consolidation
23.5 → 80.4
$23K
Influencer revenue · on $9.25K spend
Attributed
7 years
Continuous retention · enterprise account
Still running
06
THE UNLOCK
The machine is the product.
Samsung Display can put a product launch, a trade show, a press release, and eleven vertical narratives through social in the same week, cleared by legal, tagged for reporting, and answerable in the next quarterly review. That capacity is not a campaign. It is infrastructure.
Enterprise brands do not lose social because the creative is weak. They lose it because nothing gets through the approval chain fast enough to matter, and the work that survives arrives late, generic, and untagged.
Nobody keeps an agency for seven years because the ideas were good. They keep one because the machine held.
Running an enterprise brand with no internal creative team?
We run the whole operation: vertical content, Sprinklr, executive social, influencer, on-site production, and PR readiness, with every number traced to a named QBR. Seven years at Samsung Display. Let’s build yours.
Ready to Maximize Your Social Media
Potential?
We’d love to hear about your organization’s goals on social media. Get in touch with us today!
If submitting a RFP please use the email below.
rfp@sociallyin.com