
CARNIVAL CRUISE LINE
270,400 comments. Three community managers. And the complaints stopped winning.
Carnival’s social channels were taking more than Carnival’s in-house team could clear, at peak, roughly 50,000 inbound touchpoints a month across seven channels. We put three community managers on it, seven days a week, for over a year and a half. Across the engagement, 270,400 post comments came in on the four biggest channels. We answered 59,900 of them, every one that warranted a human reply, inside 24 hours. When we started, negative sentiment on Twitter was running ahead of positive. By Q1 2023, positive was running about five times in front.


270,400
Post comments across 4 channels · 59,900 replied

~10×
Positive sentiment growth · FB & IG · Q4 2021 → Q1 2023

1.2M
Estimated impressions earned on Twitter through community management

CLIENT
Carnival Cruise Line

Industry
Cruise & Travel

Engagement
Community Management · 2021 – 2023

Offering this proves
Community Management
01
THE STUCK POINT
Six million followers. One in-house
team. A queue nobody could clear.
Carnival guests hide rubber ducks around the ship for strangers to find. Nobody in marketing invented that. It started in the comments and it still lives there, alongside people asking how to make friends onboard and what to pack for formal night. That comment section was the single best thing Carnival owned.
It was also where the refund complaints lived. And the slow-customer-service threads. And every person still waiting on a cancellation refund.
Facebook alone had over 5.1 million followers. Instagram had 840,000. Twitter had 313,000. TikTok was climbing fast enough to add 18% in a single month. Carnival’s internal social team was covering all of it, on top of everything else they owned, and the volume ran to roughly 50,000 inbound touchpoints a month across seven channels. It did not stop at 6pm. It did not stop for Christmas.
The diagnosis: the problem was never the volume. An unanswered comment section defaults to whoever complains loudest, and Carnival’s had been defaulting for a while. They did not hire us to clear a queue. They hired us to change what the room sounded like.
Inbound per month
~50,000
Across 7 channels at peak
Twitter sentiment · start
Negative ahead
~2,700 vs ~1,000 positive
The real hire
Change the room
Not just clear the queue
02
THE BET
Give the brand a voice. Then go find the conversations it was never invited to.
The first half was the obvious one, done properly. Most brands answer comments like a help desk: acknowledge, deflect, close the ticket. We built Carnival a voice instead, custom everywhere it needed to be, canned only where one right answer actually exists. The second half was the bet most brands will not take: go find the people who never tagged the account.
A Real Voice. Then Outbound.
The move most brands will not take
Most brands wait to be tagged. We went and found the people who never did, a listening layer surfaced untagged mentions and hashtag use across the category, and the team went out to reply as Carnival on posts that never asked for a brand to show up. A guest who gets answered where they never expected it tells everyone. On Twitter alone, community management earned an estimated 1.2 million impressions. That is reach Carnival did not post for and did not pay for.

Build a Real Voice
Canned responses only where one right answer exists, embarkation times, deck plans, refund policy. Custom everywhere else. The rule: sound like a person who genuinely likes cruising, not a brand performing enthusiasm.

Go Find the Untagged
A large share of people who posted about Carnival never tagged the account. They posted from the lido deck. They used a hashtag. Inbound tools only see what points at you, they were invisible. We put a listening layer over the whole category and sent the team out to comment on posts that never asked for a brand to show up.
The move most brands will not take
Most brands wait to be tagged. We went and found the people who never did. A guest who gets answered where they never expected it tells everyone.
03
THE WORK
Three people. Seven channels.
Seven days a week.
This is the whole machine. It is smaller than people expect, which is the point. This is what it actually costs to hold a comment section for a brand with six million followers. Three community managers, one shared workflow, no gaps in the week.
59,900 replies
The Queue
Every inbound comment across seven channels, routed, triaged, and cleared inside 24 hours. An approved library handled repeat questions so the team’s time went to comments that needed a human. Every comment that warranted a reply got one.
24-hr turnaround · every reply
The Coverage
The Outbound
The Split

Surprise & Delight
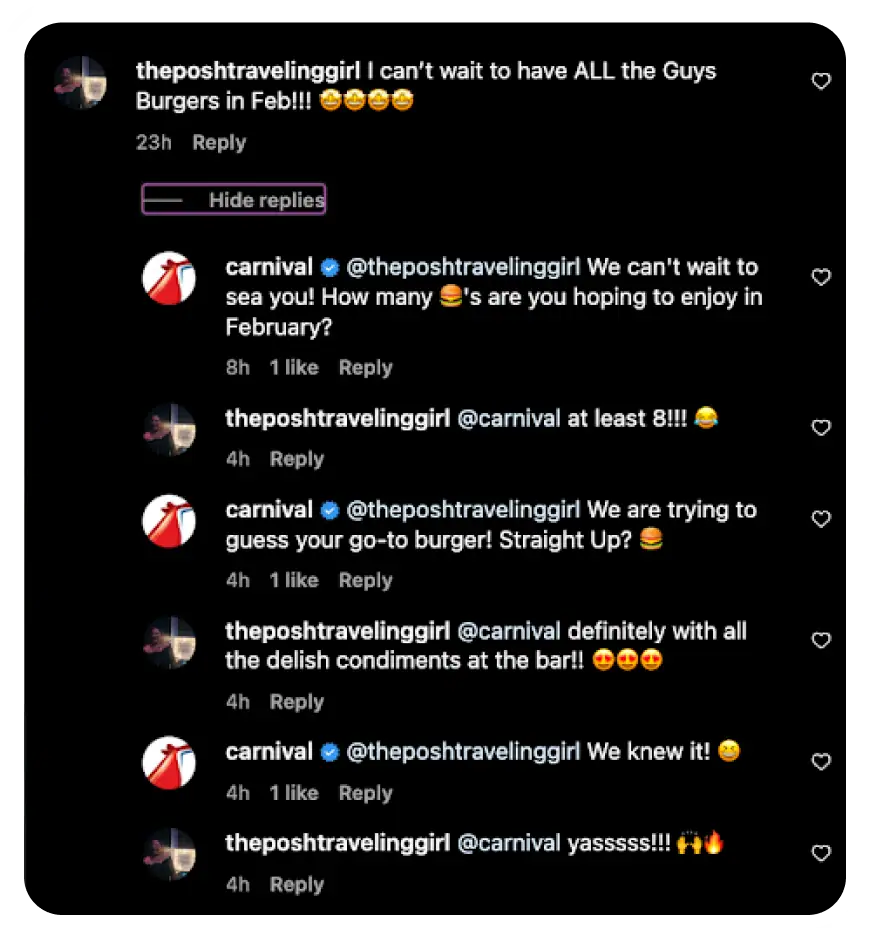
Getting answered became part of the vacation. The comment section had turned into the venue.

Carnival Cruise Line
Community Management · 2021–2023
Comments in
270,400
Replies out
59,900
Delighted
319
04
THE INFLECTION
Q3 2022. The quarter the positive mentions passed the negative ones.
Twitter was the hardest channel and the honest one. In Q4 2021, negative sentiment volume on Carnival mentions ran ahead of positive, roughly 2,700 against 1,000. Not close. That was the number Carnival hired us on, and it is the number most agencies would leave out of the case study.
Through 2022 the positive line climbed and the negative line did not follow it. The two crossed in Q3 2022. By Q1 2023 positive was running around 9,400 against negative’s 2,000, on the same channel where it had been losing at the start. Facebook and Instagram are the volume version of the same story. Positive sentiment volume grew roughly tenfold from Q4 2021 to Q1 2023 on both. Negative grew too, off a very small base, but it never got above roughly 1,400 in a quarter on either channel while positive cleared 16,000. We did not shrink the complaints. We made them a much smaller share of a much bigger room.
Twitter mention sentiment · Q4 2021 → Q1 2023
Positive
NEGATIVE
Q4 2021
Q1 2023
Q4 2021 · start
~1K
Positive
~2.7K
Negative

Q1 2023 · end
~9.4K
Positive
~2.0K
Negative
05
THE PROOF
Negative Was Ahead When We Walked In. By Q3 2022 It Never Led Again.
Comment and reply totals from Sociallyin’s quarterly reporting for Carnival Cruise Line, December 2021 through March 2023. Sentiment figures read from charts in the 2023 reporting deck, stated as approximations. See methodology note below.
The Volume · Dec 2021 – Mar 2023
Metric
Result
Context
Details
C
Metric
Total Post Comments Handled
270,400
Result
4 channels
Context
Facebook 121,200 · Instagram 63,600 · TikTok 52,400 · Twitter 33,200
Details
R
Metric
Replies Written by Sociallyin
59,900
Result
24-hr SLA
Context
Every comment that warranted a human reply got one inside 24 hours, seven days a week including holidays
Details
T
Metric
Team Size Holding Seven Channels
3 people
Result
7 channels
Context
Roughly 50,000 inbound touchpoints a month at peak for a brand with six million followers
Details
The Sentiment · Twitter Mention Tracking · Q4 2021 → Q1 2023
Metric
Result
Context
Details
T
Metric
Twitter Positive Sentiment · Start
~1,000
Result
Q4 2021
Context
Against ~2,700 negative. Negative was winning by a wide margin when we walked in.
Details
T
Metric
Twitter Positive Sentiment · End
~9,400
Result
Q1 2023
Context
Against ~2,000 negative. Positive running roughly five times in front on the hardest channel.
Details
C
Metric
Crossover Quarter
Q3 2022
Result
Context
The quarter the positive line passed the negative line, and opened a gap that never closed
Details
The Shift · What the Replies Bought
~10×
Positive sentiment growth
Growth in positive sentiment volume on Facebook and Instagram from Q4 2021 to Q1 2023
Negative on both channels stayed under roughly 1,400 a quarter while positive cleared 16,000. We did not shrink the complaints. We made them a smaller share of a much bigger room.
1.2M
Earned impressions · Twitter
Estimated impressions earned through community management on Twitter alone
Reach Carnival did not post for and did not pay for.
319
Guests surprised & delighted
Guests personally recognized across the full engagement, each identified from the comments
Every one vetted, approved by Carnival, delivered with a personalized graphic or video, and logged.
Methodology: Comment and reply totals are from Sociallyin’s quarterly reporting for Carnival Cruise Line, December 2021 through March 2023, covering Facebook, Instagram, TikTok, and Twitter. Q1 2023 alone ran 37,193 comments against 21,301 replies; Q2 2023 ran 41,259 against 14,191 through June 8 where the reporting window closes. The ~50,000 monthly figure is total inbound across all seven channels, including direct messages, mentions, and untagged listening hits, at peak volume. It is a wider count than the 270,400 public post comments on the four reported channels; the two figures count different things and should not be compared directly. “Every comment that warranted a reply” means exactly that: reply-rate percentages in the quarterly reports are calculated against all comments including spam, duplicates, and emoji-only responses. All sentiment figures and the Q3 2022 crossover quarter are read from charts in the 2023 reporting deck, which plot volume without data labels. They are stated here as approximations. Sentiment is measured on Carnival brand mentions across social, a different set than post comments on Carnival’s own content, and the two should not be added together. The ~10× positive sentiment growth figure refers to Facebook and Instagram; the Twitter figure (roughly 1,000 → 9,400 positive mentions) is cited separately and represents a 9.4× increase. Surprise & Delight: 64 candidates identified and 34 completed as of March 2023; 319 is the program total for the full engagement.
270,400
Comments handled · 4 channels
59,900
replies
~10×
Positive sentiment growth · FB & IG · Q4 2021 → Q1 2023
Positive cleared 16,000
1.2M
Earned impressions · Twitter
Not posted · not paid
319
Guests surprised & delighted
Hand-picked
Q3 2022
The quarter the positive line passed the negative one
And never crossed back
06
THE UNLOCK
Getting answered became part of the vacation.
The thing that compounds is not the reply. It is what the reply does to everyone else reading the thread. Guests started posting about their week at sea and hoping Carnival would show up. When it did, they said so, in the same comment section, in front of everyone. A brand reply stopped being customer service and became something worth screenshotting.
You can see it in the moments. Carnival’s 50th birthday pulled 1,600 replies on Facebook in one celebration, plus 200 replies and comments on Instagram and 58 on Twitter. The comment section had turned into the venue.
None of that came from posting more. It came from three people answering every comment that needed an answer, seven days a week, across a year and a half, and from going out to find the people who never asked to be found.

Who’s answering your comments at 11pm on a Sunday?
Community management runs whether you staff it or not. An unanswered comment section defaults to whoever complains loudest. We staff it seven days a week, inbound, outbound, and Surprise & Delight for brands ready to change what the room sounds like.
Ready to Maximize Your Social Media
Potential?
We’d love to hear about your organization’s goals on social media. Get in touch with us today!
If submitting a RFP please use the email below.
rfp@sociallyin.com