
Case Study · House of Angostura
The oldest name behind the bar was asleep on social. We woke it up.
Angostura bitters have been in the world’s cocktails since 1824. In the quarter before Sociallyin’s content engine went live, the brand’s channels published five posts. Two years as agency of record later: engagement rate up from 0.1% to 7.2%, 9,165 net new Facebook followers in the last sixteen reported months, and the brand’s first influencer program returning $111.5K in earned media value from six working mixologists.


0.1% → 7.2%
Combined ER · Q1 2022 → Jun 2023

+9,165
Net new Facebook followers · 16 months

$111.5K
Earned media value · first influencer campaign ever

CLIENT
House of Angostura

Industry
Spirits · Aromatic Bitters

Engagement
Agency of Record · 2021-2023

Offering this proves
Full-Service Social Media Management
01
THE STUCK POINT
A 200-year-old giant with 128,000 followers and nobody home.
Angostura is not a challenger brand. It is the bitters. Owned by the government of Trinidad and Tobago, carrying a royal warrant, sitting in the well of nearly every bar on earth. An Old Fashioned without it is just whiskey and sugar. The product had a two-century head start on every competitor in the category.
The social presence had none of that authority. The strategy was fragmented across channels, with no engine for the content the product actually lives in: cocktail recipes, food recipes, all the ways a dash of bitters gets used beyond the bar. In the final quarter before our calendar went live, the accounts published five posts. Total. A combined audience of roughly 128,000, nearly all of it on Facebook, was slowly shrinking, and the mixologist community, the people who touch the bottle every single shift, heard nothing from the brand at all. Angostura had never worked with an influencer. Its annual cocktail competition for mixologists drew limited submissions and less conversation.
The diagnosis: awareness was never the problem. Every bar on earth stocks the bottle. The most famous ingredient in cocktail culture simply had no working voice inside that culture.
5
Posts · Q4 2021
Last quarter before our calendar went live
0.1%
Engagement rate
Q1 2022 starting baseline
Zero. Never.
Influencer history
Brand had never run one
02
THE BET
Ship the bitters to our studio. Hand
the bar community the microphone.
The safe play for a heritage spirits brand is polish: one prestige campaign a year, a press cycle, then silence. Angostura had been living that silence. We proposed the opposite: volume, warmth, and daily presence, produced by us, because the brand had no production engine of its own.
The Studio. The Microphone. The
Standard.
24-hour response commitment ·
held across two years


The Studio
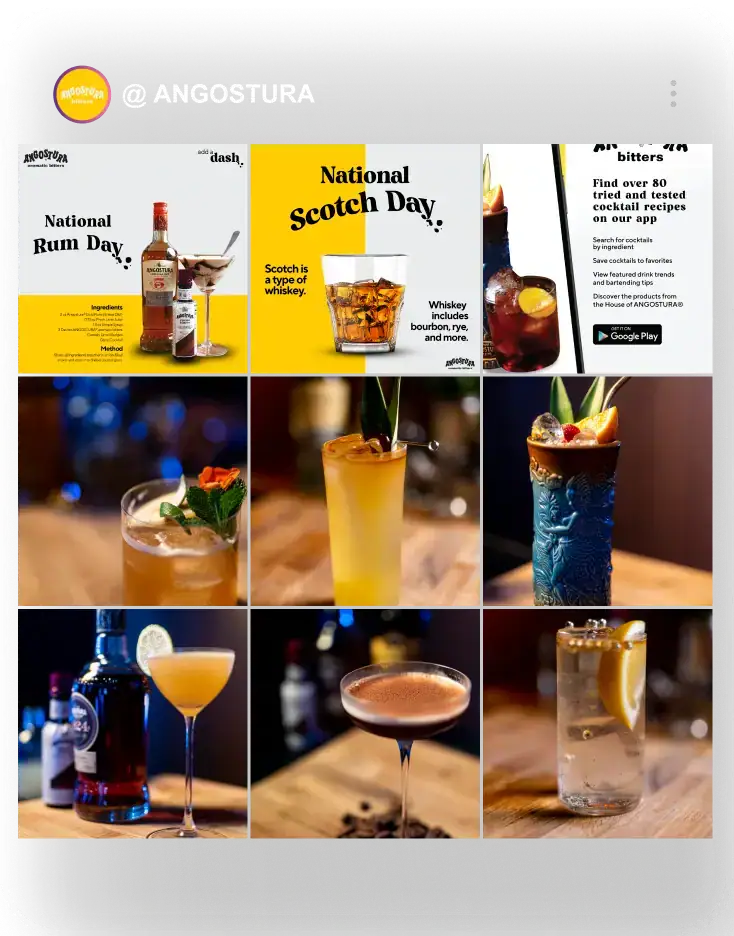
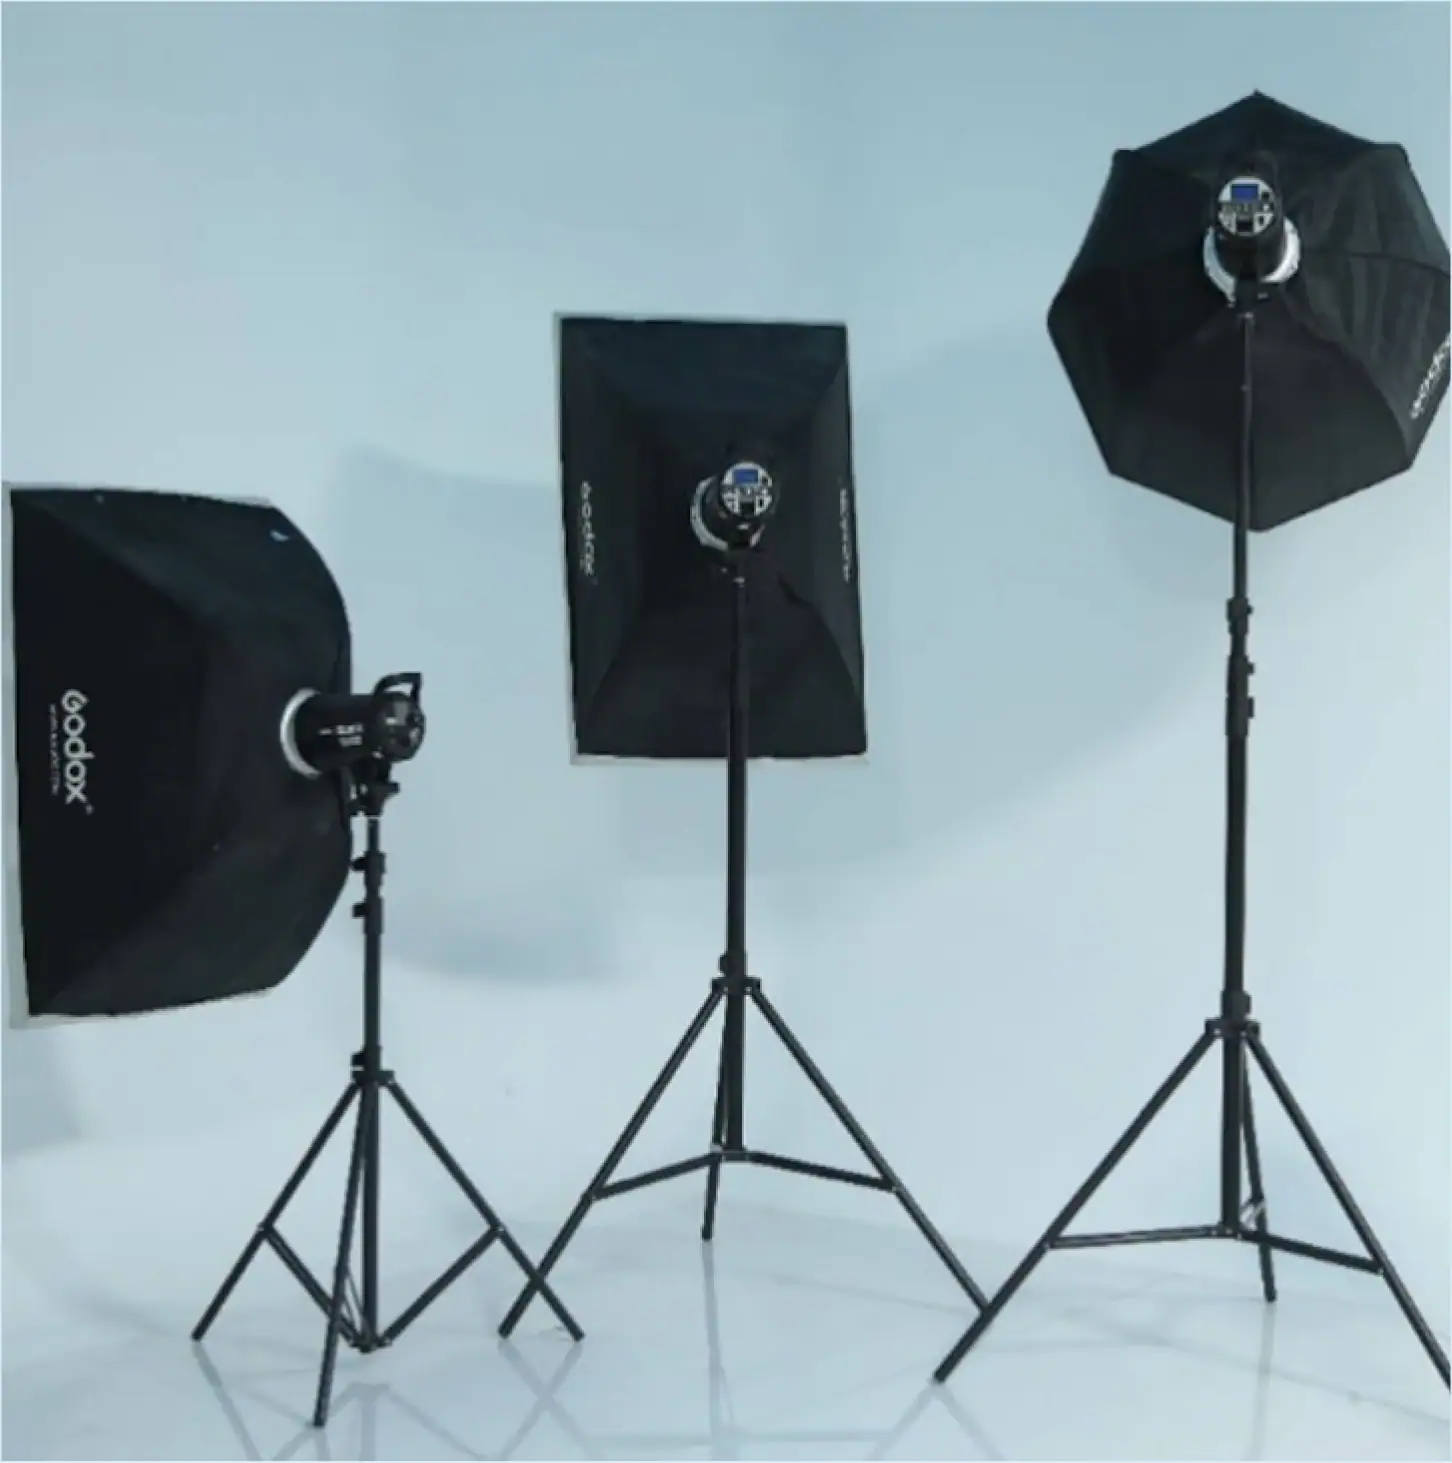
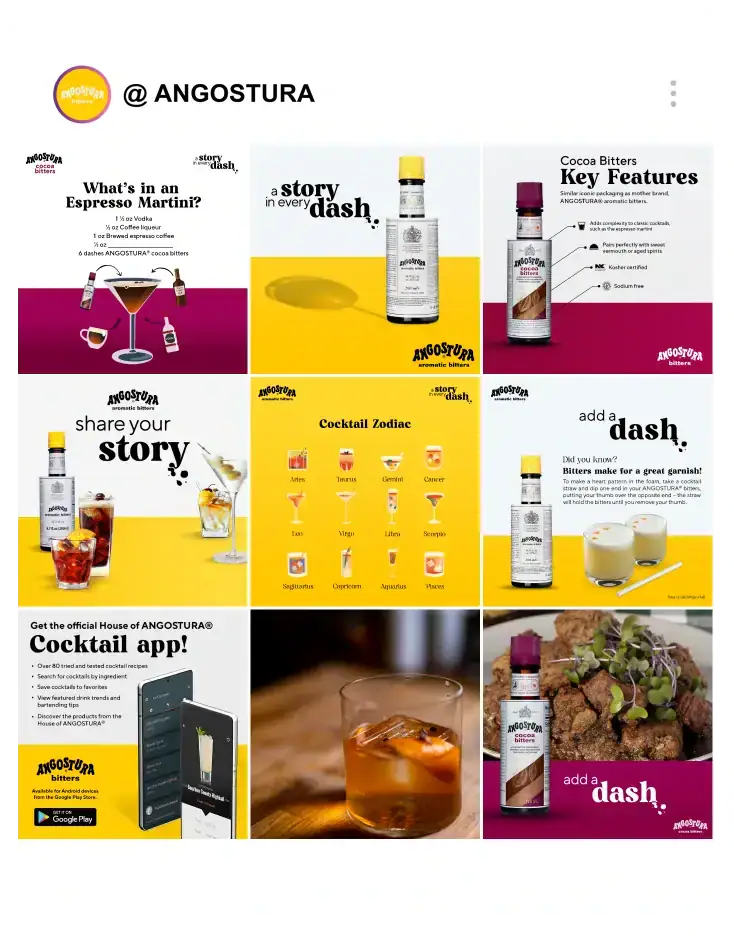
Angostura shipped product to Sociallyin. We became the brand’s content operation, cocktail videos, recipe videos, product photography, B-roll banked across every format. Pools, parties, home kitchens, bars. Bitters outside the bar for the first time.

The Microphone
The mixologists Angostura couldn’t reach would listen to their own. The brand that had never worked with an influencer handed its story to working bartenders and cocktail creators, including a campaign built around the annual mixologist competition.

The Standard
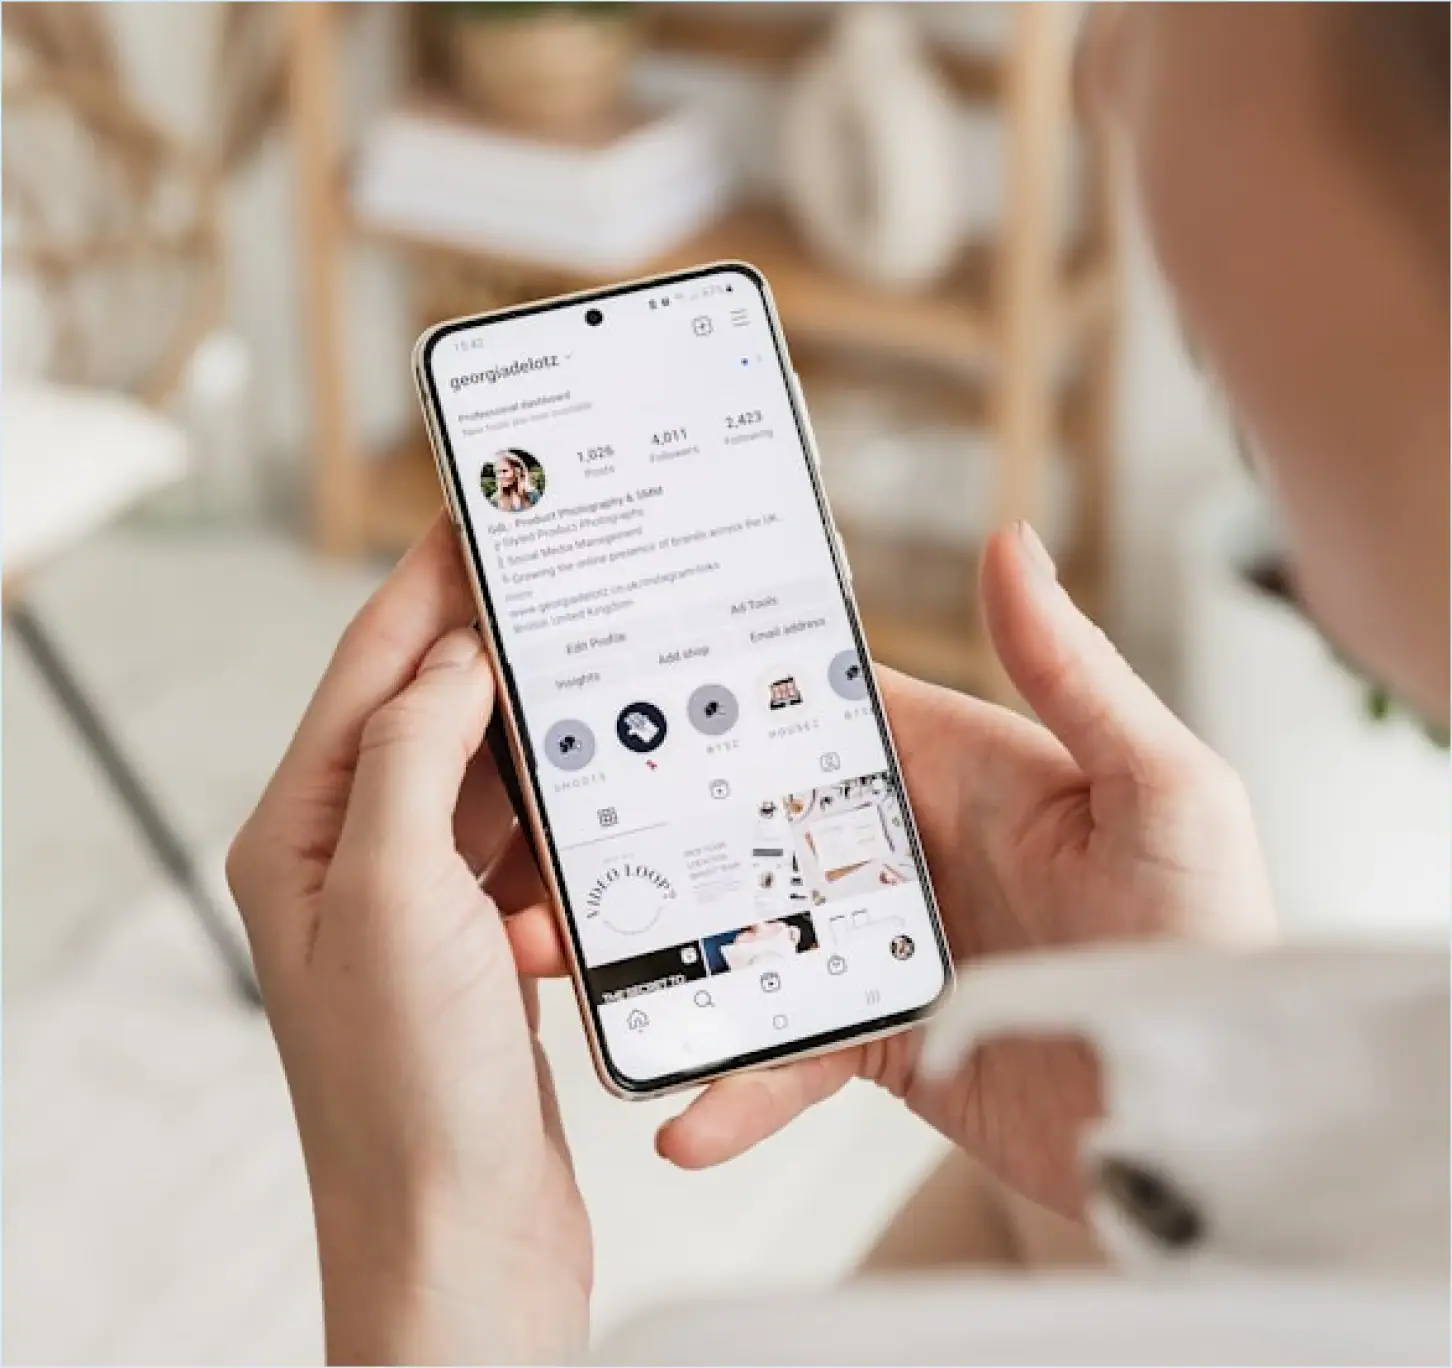
Every comment on every channel answered within 24 hours. Every one. Inbound and outbound engagement in the mixologist and home-bartender community. Quarterly sent messages more than doubled from 64 to 141.
24-hour response commitment ·
held across two years
03
THE WORK
One brand, run as a working social operation. Six moving pieces.
Five posts a quarter became 41 in our first quarter, then as many as 93. The volume was the visible part. Underneath it: a studio, a calendar, a community desk, an influencer roster, a competition campaign, and a paid engine, all running as one connected operation.
In-House Production
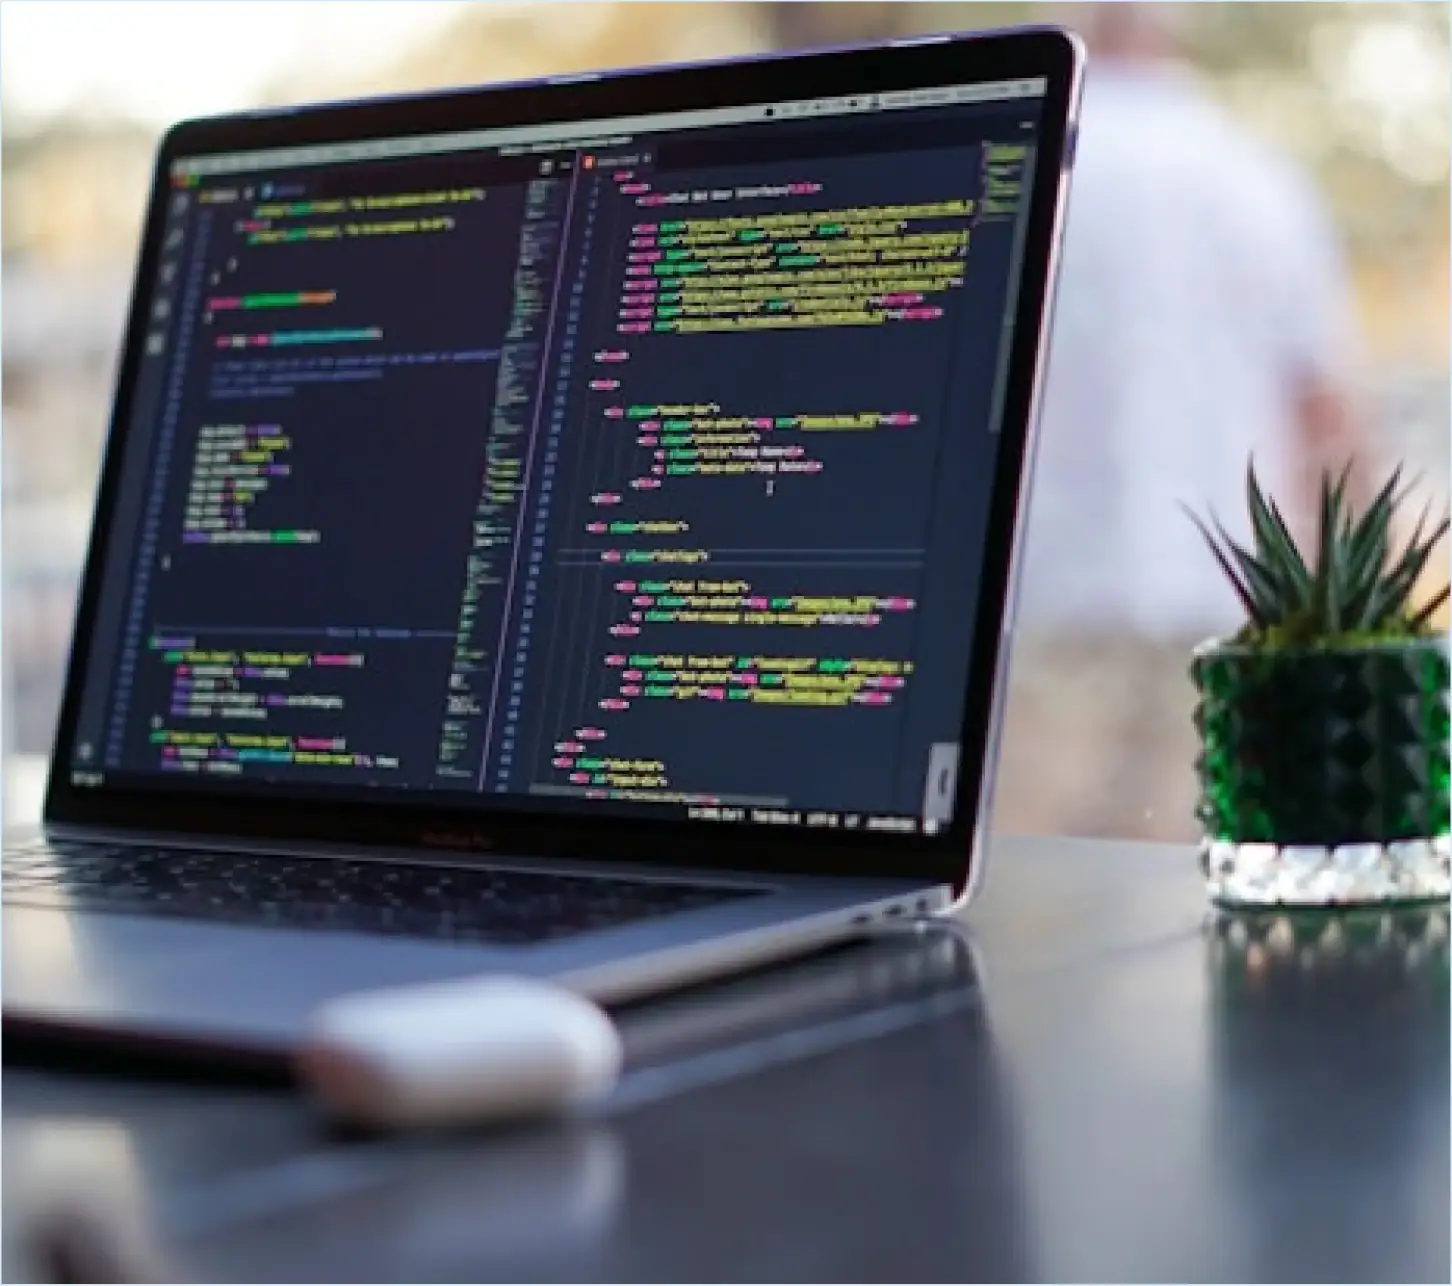
Angostura shipped product; we shot cocktail videos, recipe videos, product photography, and B-roll banked for reuse. Pools, parties, bars, home kitchens, bitters in more scenarios than a dim speakeasy.
Cocktails · food · lifestyle · location rotation
5 Posts → 93
Inbound & Outbound
First Program, Ever
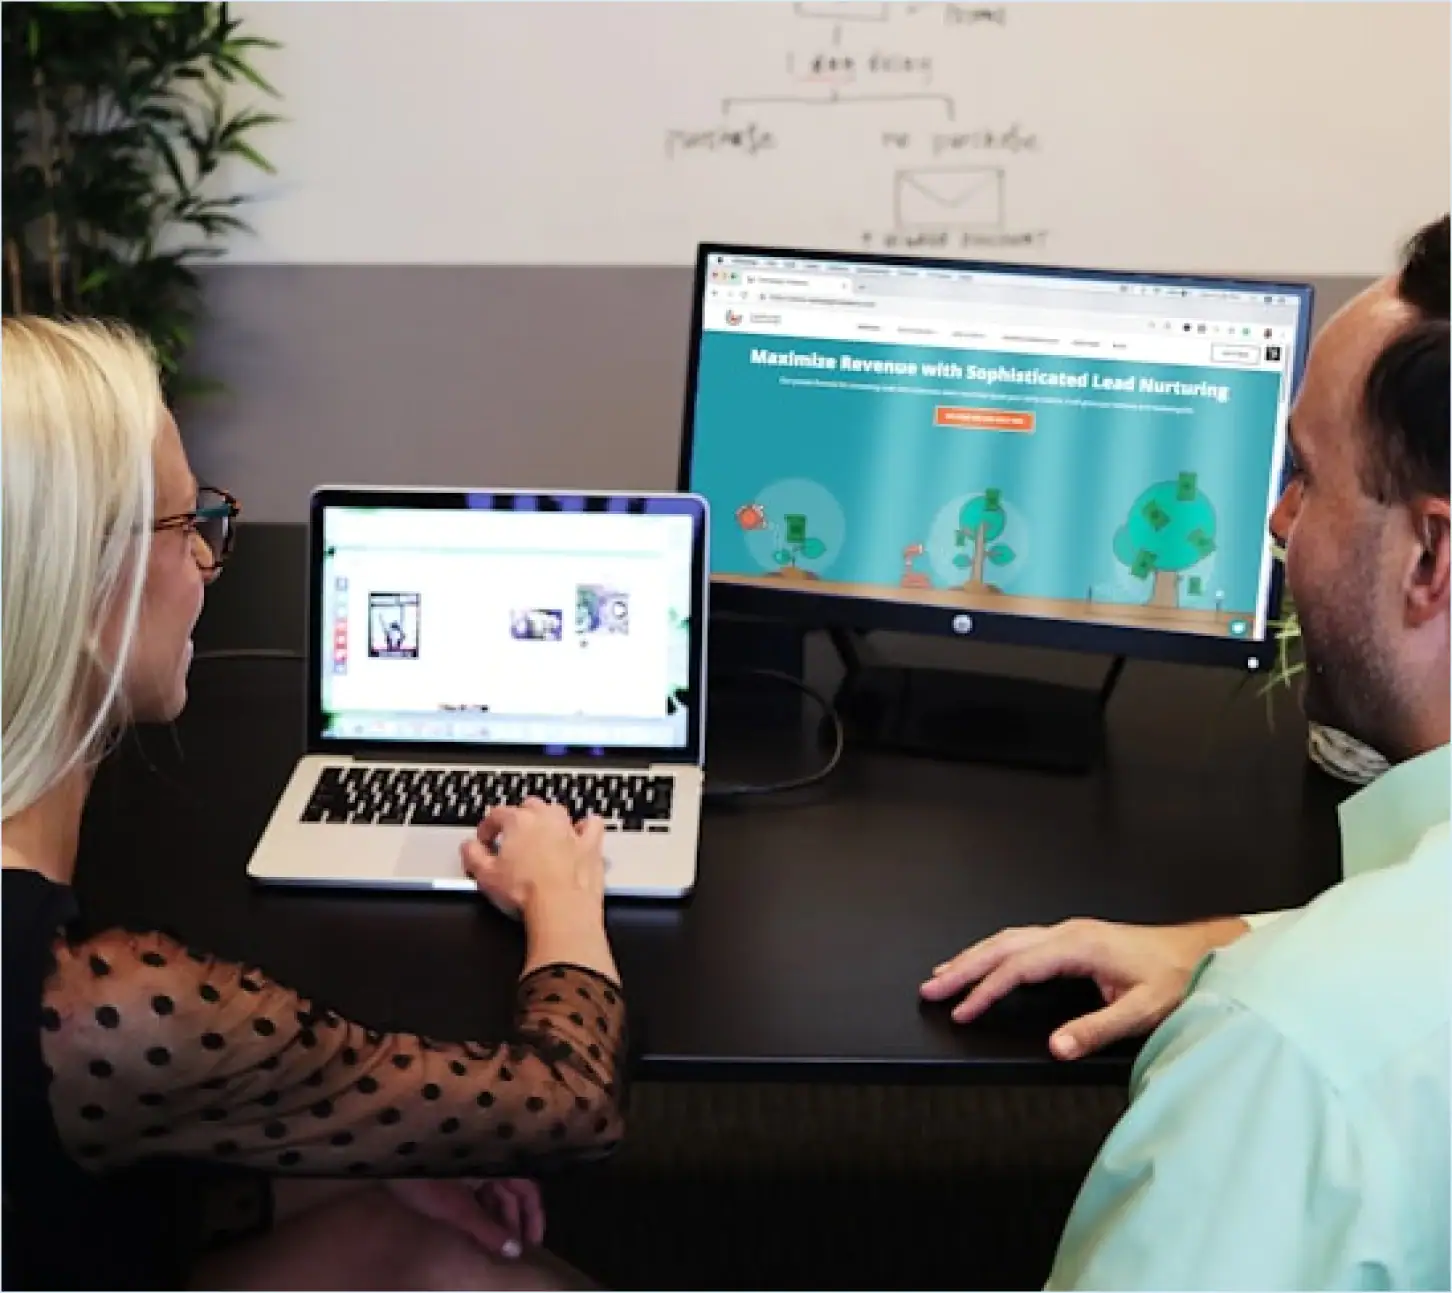
Promoted Like It Mattered
Awareness + Traffic

The giant was never dead. Nobody was running the room. Now somebody is, and the community knows it.

House of Angostura
Agency of Record · 2021–2023
ER · Jun 2023
7.2%
FB followers
+9,165
Influencer EMV
$111.5K
04
THE INFLECTION
The ads went dark for a quarter. The community didn’t.
In Q3 2022, paid media went fully off. Impressions collapsed 99%. On most accounts, that is the quarter you leave out of the case study.
Here it became the proof. With no ads running at all, engagement rate more than doubled to 2.8%. Instagram’s rate hit 6.7%, the account added 203 followers, and the combined channels posted their best net audience growth of the engagement to that point, up 564% on the prior quarter.
Impressions fell
−99%
Paid media fully off · Q3 2022 · no ads running at all
Same quarter
Q3 2022
Engagement rate rose
2.8%
Up from the 0.1% Q1 2022 baseline · Best net audience growth of the engagement to that point, +564%
The people commenting weren’t rented. They had moved in. That was the quarter the work stopped being a media plan and became a community.
05
THE PROOF
Sixteen months of receipts.
Every figure traces to a named report: Sprout lifetime exports for Mar 1, 2022 – Jun 30, 2023, quarterly profile reports, 2022 annual review, Klear influencer campaign report, and platform ad reports.
The Channels · Mar 2022 – Jun 2023
Metric
Result
Vs. Prior Cycle
Details
$
Metric
Net New Facebook Followers
+9,165
Result
+276.7%
Vs. Prior Cycle
Over sixteen reported months · best single month: +1,246 in June 2023
Details
$
Metric
Facebook Engagements
155,392
Result
+81.5%
Vs. Prior Cycle
Post link clicks grew 9,623.6% to 23,920
Details
I
Metric
Combined Impressions
9.0M
Result
IG +61.9%
Vs. Prior Cycle
Facebook 6.12M · Instagram 2.90M
Details
The Community
Metric
Result
vs. Prior
Details
R
Metric
Combined Engagement Rate
7.2%
Result
from 0.1%
vs. Prior
Q1 2022 → June 2023 · through 2.8% Q3 2022, 3.06% Q1 2023
Details
C
Metric
2022 Organic Post Engagement Rates
4.38% / 6.99%
Result
FB / IG
vs. Prior
vs. category benchmarks 0.1–0.2% (FB) and 0.8–0.9% (IG) · 2022 annual review
Details
L
Metric
Instagram Comments Growth
+250.9%
Result
Mar 2022 – Jun 2023
vs. Prior
Every comment on every channel answered within 24 hours · inbound and outbound
Details
The Programs · Influencer, TikTok, Paid
Methodology: Follower growth and engagement totals are Sprout lifetime figures for Mar 1, 2022 – Jun 30, 2023; deltas compare the prior equivalent period. The 0.1% and 7.2% ER are combined-channel figures from the Q1 2022 quarterly report and June 2023 monthly report; the 4.38%/6.99% figures are organic post-level rates from the 2022 annual review using a different basis. Earned media value per the Klear campaign report. No projections, no modeled numbers.
$111.5K
Earned media value · brand’s first-ever influencer campaign
6 working mixologist creators · 11 posts · Sep–Nov 2022 · 356.1K reach · 809.2K impressions · 83% cocktail-interested audience · 71% bartending-interested
11,613
TikTok followers · seven-day ad test
At $0.105 per follower · proof of concept for platform expansion
£0.002
Cost per engagement · June 2023 paid push
Traffic ads at £0.05 CPC · page-like, traffic, and engagement campaigns across Facebook and Instagram
06
THE UNLOCK
The giant was never dead. Nobody was running the room.
Nothing about Angostura changed in two years. Same bottle, same recipe, same two centuries of history. What changed is that the brand finally had an operation matched to its stature: a studio producing at feed speed, a calendar that showed up daily instead of quarterly, a desk answering every comment, and a roster of working mixologists carrying the story into the one community that matters most.
That is what full-service means here. Not a vendor for posts. The entire social operation of a global brand, run from our studio, accountable to the numbers above.
A heritage brand doesn’t need a louder voice. It needs a working one.
Sitting on a brand
bigger than its feed?
We run the whole operation: strategy, studio production, community, influencers, and paid, with every number traced to a named report. Let’s wake yours up.
Ready to Maximize Your Social Media
Potential?
We’d love to hear about your organization’s goals on social media. Get in touch with us today!
If submitting a RFP please use the email below.